The 2025-26 Economic Report on Pharmaceutical Wholesalers and Specialty Distributors
The 2025-26 Economic Report on Pharmaceutical Wholesalers and Specialty Distributors
By Adam J. Fein, Ph.D.
(Downloadable 413-page PDF file. Released October 2025.)
Corporate License + PowerPoint file with Exhibits: $15,900 BUY
(Allows for use of the report by an unlimited number of employees within the same organization or enterprise worldwide. Pre-orders receive their secure download link prior to the release date. Includes an additional PowerPoint file with all 187 exhibits that are included in the report. The exhibits appear within the report text of all license versions. Secure download link sent prior to the release date. View License Terms.)
Corporate License: $14,900 BUY
(Allows for use of the report by an unlimited number of employees within the same organization or enterprise worldwide. Pre-orders receive their secure download link prior to the release date. View License Terms.)
Department/Team License: $10,900 BUY
(Allows for use of the report by 2 to 10 employees within the same organization or enterprise. Pre-orders receive their secure download link prior to the release date. View License Terms.)
Single-User License: $1,900 REQUEST
(Allows for use of the report by one individual person. View License Terms. Drug Channels Institute (DCI) must approve all single-user license purchases before download.Single-user licenses are not available to investment/financial firms, multi-person consulting firms, publicly traded companies, or organizations with more than 10 employees. Ineligible purchases will be promptly refunded.)
Purchasing Information
- Download a free 25-page overview of the 2025-26 report.
- Payment can be made with all major credit cards (Visa, MasterCard, American Express, and Discover). Click here to contact us if you would like to pay by corporate check or ACH.
- License terms, purchaser’s name/email, and a unique transaction ID will be added to the secure PDF file upon checkout. All sales are final after download.
- Drug Channels Institute (DCI) must approve all single-user license purchases after purchase but before download. Single-user licenses are not available to investment/financial firms, multi-person consulting firms, publicly traded companies, or organizations with more than 10 employees. If your purchase is approved, then you will receive an email with a link to download the report. If you are not eligible for a single user license, DCI will promptly refund your purchase to the original form of payment. DCI reserves the right to reject any purchase, and it is under no obligation to explain individual decisions.
- Already purchased and need a broader license? Email us to upgrade. You’ll pay only the difference in license fee. Please respect our license terms.
- ALL SALES ARE FINAL AFTER DOWNLOAD. If you have purchased this report in error, please contact us before downloading.
Despite a turbulent business and policy environment, pharmacy and healthcare provider markets continue to post robust revenue growth. During this period of volatility the largest wholesalers are accelerating vertical integration while strengthening their underlying economics.
The 2025-26 Economic Report on Pharmaceutical Wholesalers and Specialty Distributors examines the most crucial commercial, political, financial, and legal forces driving industry change.
The 2025-26 Economic Report on Pharmaceutical Wholesalers and Specialty Distributors—our sixteenth edition—remains the most comprehensive, fact-based tool for understanding and analyzing the large and growing U.S. pharmaceutical distribution industry. Widely regarded as the industry standard, this unique, encyclopedic resource is your ultimate guide to wholesale distribution’s role in the complex web of interactions within U.S. prescription drug channels. Download a free overview of the 2025-26 report.
This definitive, nonpartisan resource thoroughly updates DCI’s annual exploration of the wholesale industry’s interactions with—and services for—other participants in our healthcare system.
The research and writing for this report were led by Adam J. Fein, Ph.D., one of the world’s leading experts on the drug distribution industry and the author of the influential Drug Channels website. The report synthesizes a wealth of statistical data (including 187 data-rich exhibits), research studies, financial information, and Dr. Fein’s extensive experience.
That’s what makes this report essential reading for pharmaceutical manufacturers, wholesalers, pharmacists, pharmacy owners, hospital executives, pharmacy buyers, benefit managers, managed care executives, policy analysts, investors, consultants, and anyone else who wants to understand and benefit from this ever-changing industry.
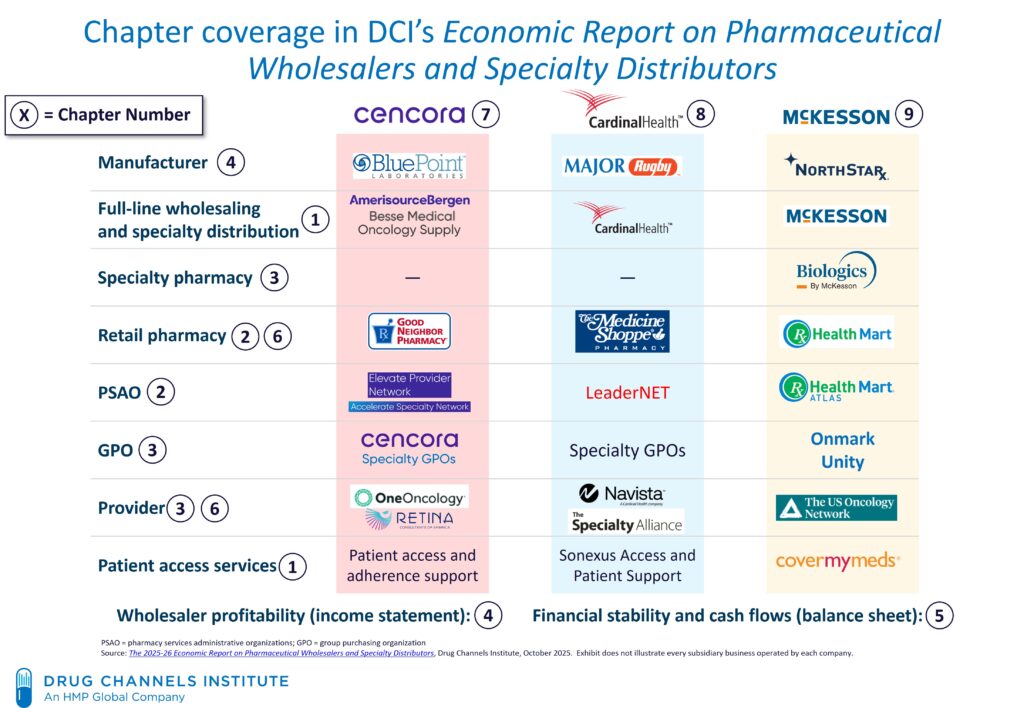
This 2025-26 edition contains the most current financial and industry data about the distribution of pharmaceuticals and the major companies that handle these products. As always, we have updated all market and industry data with the most current information available. The report also updates our annual analyses of the strategies, market positions, and executive compensation of the three largest companies: Cencora, Cardinal Health, and McKesson. We review each wholesaler’s business segments and underlying business profitability, based upon our proprietary economic models. This information allows you to assess differences among the public wholesalers’ business organizations, strategies, and financial performance. Where appropriate, financial data have been restated based on updated disclosures.
The chart below highlights the vertical alignment for each company’s major businesses and those businesses’ diverse roles within the U.S. healthcare system. The numbers in the chart indicate the report chapter that corresponds to, explains, and analyzes each business.

The notable new material in this 2025-26 edition includes the following:
- Section 3.2.2. adds new information about commercial payers’ reimbursement for provider-administered biosimilar drugs.
- Section 3.4.1. includes new proprietary data on hospitals’ economics for prescription drug expenses.
- Section 4.5.3. present new data that quantifies the penetration of wholesalers’ private-label generic drugs into government programs.
- A new Section 6.1.5. evaluates the potential implications of most favored nation (MFN) and tariff policies on the wholesalers’ businesses.
- Section 6.2.4. has been expanded to cover new developments in cash-pay prescriptions and manufacturers’ direct-to-patient channels.
- Section 6.3.2. has been expanded to include more complete and current data on wholesalers’ acquisition of management service organizations (MSOs).
- Section 6.5. has been revised to reflect the ongoing implementation of the Inflation Reduction Act of 2022.
- In Section 6.5.1., we update our review of key provisions of the law that relate to prescription drugs.
- In Section 6.5.2., we update our analyses of the IRA’s likely consequences for wholesalers and the overall pharmaceutical business.
- Section 9.2.2. presents revenue and profit information for McKesson’s businesses based on restated 2025 financial information for the reporting structure that the company adopted during its 2026 fiscal year.
- Coverage of UnitedHealth Group’s Optum Rx wholesaler relationship has been moved to Section 9.3.4., reflecting the business shift from Cardinal Health to McKesson.
- There are 187 exhibits in this 2025-26 edition, compared with the 178 exhibits in the 2024-25 edition. Most exhibits are new or fully updated from the previous year’s edition.
No other report on the market today offers the depth, insight and analysis of the 2025-26 Economic Report on Pharmaceutical Wholesalers and Specialty Distributors.
LICENSE TERMS
THIS END USER LICENSE AGREEMENT (“Agreement”) governs your use of The 2025-26 Economic Report on Pharmaceutical Wholesalers and Specialty Distributors (“Report”) provided by HMP Omnimedia, LLC, an HMP Global Company, d/b/a Drug Channels Institute, (“DCI”) under this Agreement made available to, or accessed by, you (“Purchaser”). Purchaser may cite this Report in commercial documents with full and appropriate attribution. Nothing in the license is intended to reduce, limit, or restrict any rights arising from fair use under copyright law or other applicable laws.
License terms, purchaser’s name/email, and a unique transaction ID are embedded in the secure PDF file upon checkout. You must purchase a Department/Team or Corporate License if you want to share the report with other people in your company. Upon request, we will refund duplicate purchases of a Corporate License from the same organization.
We offer three License Options:
- Single User License: This license allows for use of the Report by one individual person. This person may use the Report on any computer, and may print out the Report, but may not share the Report with any other person or persons. DCI does not permit the purchase of a single user license by individuals working at investment/financial firms, multi-person consulting firms, publicly traded companies, and any organization with more than 10 (ten) employees. Purchasers who violate this limitation are liable for a Department/Team or Corporate License fee.
- Department/Team License: This license allows for use of the Report by 2 (two) to 10 (ten) employees within the same organization or enterprise as the purchaser identified in the upper left corner of this page. Each of these employees may use the Report on any computer, and may print out the Report, but may not share the Report with any other person or persons unless a Corporate License is purchased. Purchasers violate this limitation are liable for a Corporate License fee.
- Corporate License: This license allows for use of the Report by an unlimited number of employees within the same organization or enterprise worldwide as the purchaser identified in the upper left corner of this page. Each of the employees within this organization or enterprise may use the Report on any computer, and may print out the Report, but may not share the Report with any other person or persons outside the enterprise or organization.
The 2025-26 Economic Report on Pharmaceutical Wholesalers and Specialty Distributors is protected by copyright law. Unauthorized reproduction or distribution of this report, or any portion of it, may result in severe civil and criminal penalties, and will be prosecuted to the maximum extent of the law. This report may be cited in commercial documents with full and appropriate attribution. Nothing in this license is intended to reduce, limit, or restrict any rights arising from fair use under copyright law or other applicable laws.
TABLE OF CONTENTS
Introduction and Guide to This Report
PREFACE: INDUSTRY TRENDS AND KEY REPORT THEMES
SECTION I: WHOLESALER AND CUSTOMER INDUSTRY ANALYSIS
Chapter 1: Industry Overview
- 1.1. Wholesale Industry Fundamentals
- 1.1.1. Defining Drug Wholesale Distribution
- 1.1.2. Full-Line Wholesalers
- 1.1.3. Specialty Distributors
- 1.1.4. Wholesalers and the Drug Supply Chain Security Act
- 1.2. The Products That Wholesalers Sell
- 1.2.1. Brand vs. Generic Drugs
- 1.2.2. Route of Administration and Benefit Coverage
- 1.2.3. Specialty vs. Traditional Drugs
- 1.3. Overview of Wholesalers’ Channel Roles
- 1.3.1. Physical Distribution
- 1.3.2. Financial Intermediation
- 1.3.3. Services for Pharmacies, Providers, and Manufacturers
- 1.3.4. Impact on Pharmacy and Provider Reimbursement
- 1.4. Industry Participants
- 1.4.1. Big Three Wholesalers: Revenue and Growth Trends
- 1.4.2. Specialty Product Distribution Market Share
- 1.4.3. Other Wholesale Market Participants
Chapter 2: Channel Role for Retail, Mail, and Specialty Pharmacies
- 2.1. The Pharmacy Market
- 2.1.1. Outpatient Dispensing Formats
- 2.1.2. Pharmacy Market Size and Structure
- 2.2. Independent Pharmacies
- 2.2.1. Industry Position and Wholesaler Relationships
- 2.2.2. Wholesaler Services for Independent Pharmacies
- 2.2.3. Franchise Programs and Marketing Groups
- 2.2.4. PSAOs and the Wholesalers’ Role in Pharmacy-Payer Relationships
- 2.2.5. Pharmacy Group Purchasing Organizations and Wholesaler Relationships
- 2.2.6. Wholesaler Generic Source Programs for Smaller Pharmacies
- 2.3. Retail Chains and Mail Pharmacies
- 2.3.1. Wholesale Suppliers to Largest U.S. Pharmacies
- 2.3.2. Physical Distribution Relationships Between Wholesalers and Retail Chains
- 2.3.3. Generic Sourcing Relationships Between Wholesalers and Large Pharmacies
- 2.4. Specialty Pharmacies
- 2.4.1. Specialty Pharmacy Market Participants
- 2.4.2. Wholesalers’ Specialty Pharmacies
- 2.4.3. Wholesalers’ Role in Manufacturer-Defined Limited Specialty Networks
Chapter 3: Channel Role for Physician Offices/Clinics and Hospitals
- 3.1. The Provider-Administered Drug Market
- 3.1.1. Outpatient Drug Spending, Sites of Care, and Market Size
- 3.1.2. The Buy-and-Bill System
- 3.1.3. Group Purchasing Organizations
- 3.1.4. Contract Management and Chargebacks
- 3.1.5. White Bagging and Specialty Pharmacies’ Role in Buy-and-Bill Channels
- 3.2. Provider Reimbursement in the Buy-and-Bill System
- 3.2.1. Medicare Part B and Average Sales Price
- 3.2.2. Commercial Health Plans
- 3.2.3. Patient Cost Sharing
- 3.3. Physician Offices
- 3.3.1. Pharmaceutical Purchasing and Distributors’ Services
- 3.3.2. Group Purchasing Organizations for Physician Practices
- 3.3.3. Specialty Drug Dispensing by Physician Practices
- 3.4. Hospitals
- 3.4.1. Pharmaceutical Purchasing and Wholesalers’ Services for Hospitals
- 3.4.2. Group Purchasing Organizations for Hospitals
- 3.4.3. Specialty Pharmacies at Hospitals and Health Systems
- 3.4.4. Wholesalers and the 340B Drug Pricing Program
SECTION II: BUSINESS ECONOMICS AND INDUSTRY TRENDS
Chapter 4: Wholesaler Profitability
- 4.1. Sources of Wholesaler Gross Profits and Gross Margin
- 4.2. Components of Buy-Side Gross Margin
- 4.2.1. Distribution Service Agreements
- 4.2.2. Payment Discounts
- 4.2.3. Specialty Distribution Service Agreements
- 4.2.4. Generic Sourcing Formularies
- 4.2.5. Provider-Administered Biosimilars
- 4.2.6. Wholesaler Compensation and Bona Fide Service Fees
- 4.3. Sell-Side Gross Margins and Cost-Minus Discounts
- 4.4. Gross Margins
- 4.4.1. Overall Gross Margins
- 4.4.2. Estimates of Buy-Side and Sell-Side Gross Margins
- 4.5. Gross Profits of Brand-Name, Biosimilar, and Generic Drugs
- 4.5.1. Lifecycle Profits for Traditional Generic Drugs
- 4.5.2. Lifecycle Profits for Provider-Administered Generic Drugs
- 4.5.3. Private Label Generic Drugs
- 4.6. The Profit Impact of Changes in Brand-Name Drug Prices
- 4.6.1. Wholesaler Fees and Brand-Name Drug Inflation or Deflation
- 4.6.2. Inventory Appreciation and Revaluation
- 4.7. Operating Expenses and Operating Profit
Chapter 5: Financial Stability and Cash Management
- 5.1. Debt, Coverage, and Liquidity Ratios
- 5.2. Balance Sheet Assets
- 5.3. Cash Conversion Cycle
- 5.3.1. Inventory Levels and Days Sales in Inventory (DSI)
- 5.3.2. Accounts Receivable and Days Sales Outstanding (DSO)
- 5.3.3. Accounts Payable and Days Payable Outstanding (DPO)
- 5.4. Capital Deployment and Uses of Cash
- 5.5. Return on Invested Capital
- 5.6. Stock Market Performance
- 5.7. Executive Compensation
Chapter 6: Forces of Change for Drug Distribution
- 6.1. Industry Outlook
- 6.1.1. The Outlook for the U.S. Pharmaceutical Market and Wholesaler Revenues
- 6.1.2. The Outlook for Brand-Name Drug Prices and Wholesalers’ Strategic Responses
- 6.1.3. The Outlook for Generic Drug Prices
- 6.1.4. Update on National Opioid Settlement Payments
- 6.1.5. Implications of Most Favored Nation Pricing and Tariffs
- 6.2. Future Trends for Pharmacy Dispensing Channels
- 6.2.1. Impact of Pharmacy Market Evolution and Vertical Integration
- 6.2.2. Challenges from Specialty Prescription Growth and Wholesaler Strategic Responses
- 6.2.3. The Growth and Profitability of Specialty Generic Drugs for Wholesalers
- 6.2.4. Cash-Pay Prescriptions and Manufacturers’ Direct-to-Patient Channels
- 6.2.5. Importation From Canada
- 6.3. Future Trends for Buy-and-Bill Channels
- 6.3.1. Hospital Vertical Integration into Physician Practices
- 6.3.2. Acquisitions of Physician Management Service Organizations by Wholesalers
- 6.3.3. Wholesalers’ Roles in Channels for Cell and Gene Therapies
- 6.4. The Impact of Biosimilars on Wholesalers
- 6.4.1. 2025 Update on the Biosimilar Market
- 6.4.2. Biosimilars Under the Pharmacy Benefit
- 6.4.3. Biosimilars Under the Medical Benefit
- 6.5. The Inflation Reduction Act of 2022
- 6.5.1. Key Provisions of the IRA for Medicare Parts B and D
- 6.5.2. Wholesale Industry Implications of the Inflation Reduction Act
SECTION III: BIG THREE WHOLESALER PROFILES
Chapter 7: Cencora
- 7.1. Business Overview
- 7.1.1. Company Information
- 7.1.2. Company History
- 7.1.3. Acquisitions and Divestitures
- 7.1.4. Business Segments
- 7.2. Profitability
- 7.2.1. Overall Pharmaceutical Distribution
- 7.2.2. Profitability by Business Sub-Segment
- 7.3. Customers
- 7.3.1. Top 10 Largest Customers
- 7.3.2. Walgreens Boots Alliance
- 7.3.3. Evernorth Health Services
- 7.4. Growth Trends
- 7.4.1. U.S. Distribution Growth Trends
- 7.4.2. MWI Animal Health
- 7.4.3. Alliance Healthcare
Chapter 8: Cardinal Health
- 8.1. Business Overview
- 8.1.1. Company Information
- 8.1.2. Company History
- 8.1.3. Acquisitions and Divestitures
- 8.1.4. Business Segments
- 8.2. Profitability
- 8.2.1. Overall Pharmaceutical Distribution
- 8.2.2. Profitability by Business Sub-Segment
- 8.3. Customers
- 8.3.1. Top 10 Largest Customers
- 8.3.2. CVS Health
- 8.4. Growth Trends
- 8.4.1. U.S. Distribution Growth Trends
- 8.4.2. Specialty Solutions
Chapter 9: McKesson Corporation
- 9.1. Business Overview
- 9.1.1. Company Information
- 9.1.2. Company History
- 9.1.3. Acquisitions and Divestitures
- 9.1.4. Business Segments
- 9.2. Profitability
- 9.2.1. Overall Distribution
- 9.2.2. Profitability by Business Sub-Segment
- 9.3. Customers
- 9.3.1. Top 10 Largest Customers
- 9.3.2. CVS Health
- 9.3.3. Rite Aid
- 9.3.4. Optum Rx
- 9.4. Growth Trends
- 9.4.1. U.S. Drug Distribution Growth Trends
- 9.4.2. McKesson’s Specialty Businesses
- 9.4.3. McKesson Europe
- 9.4.4. McKesson Canada
Acronyms and Abbreviations
Endnotes
LIST OF EXHIBITS
Exhibit 1: Vertical Alignment of Businesses Within Largest Wholesale Companies
Exhibit 2: Full-Line Wholesale Revenues, by Type of Customer, 2024
Exhibit 3: Full-Line Wholesalers, Inventory Levels vs. Product Sales, by Product Type, 2023
Exhibit 4: Full-Line Wholesalers, Inventory Levels and Product Sales, by Product Type, 2011 vs. 2023
Exhibit 5: Specialty Distributor Revenues, by Customer Type, 2023
Exhibit 6: Specialty Distributor Sales, by Therapeutic Area, 2023
Exhibit 7: Average Number of Manufacturers with Distribution Agreements for Specialty Distributors, 2015 to 2023
Exhibit 8: Distribution Center Operational Metrics, Full-Line Wholesalers vs. Specialty Distributors, 2023
Exhibit 9: Timeline of DSCSA Requirements for Pharmacies (Dispensers) and Wholesale Distributors, 2013 to 2026
Exhibit 10: Unbranded and Branded Generics, Share of U.S. Prescriptions, 2003 to 2024
Exhibit 11: Allowance for Doubtful Accounts at Big Three Wholesalers, by Company, 2024/2025
Exhibit 12: U.S. Drug Distribution and Related Revenues at Big Three Wholesalers, Calendar Year 2024
Exhibit 13: Market Share for U.S. Drug Distribution and Related Revenues, Big Three Wholesalers, 2014 vs. 2024
Exhibit 14: U.S. Drug Distribution and Related Revenues, Big Three Wholesalers, 2021 to 2025E
Exhibit 15: Revenues from GLP-1 Products, By Company, 2021 to 2025
Exhibit 16: Change in Quarterly U.S. Drug Distribution and Related Revenues, Big Three Wholesalers, 2021 to 2025
Exhibit 17: Specialty Product Distribution Revenues, by Division and Parent Company, 2024
Exhibit 18: The U.S. Pharmacy Distribution and Reimbursement System for Patient-Administered, Outpatient Brand-Name Drugs
Exhibit 19: Total U.S. Pharmacy Industry Revenues, Prescriptions, and Locations, by Dispensing Format, 2024
Exhibit 20: Independent Pharmacy Purchasing Source, by Product Type
Exhibit 21: Number of Independent Pharmacy Locations, 2001 to 2024
Exhibit 22: Independent Pharmacies as a Percentage of Full-Line Wholesaler Revenues, 2015 to 2024
Exhibit 23: Independent Pharmacies, Average Per-Prescription Gross Profits and Margins, 2019 to 2023
Exhibit 24: U.S. Pharmacy Franchise and Marketing Programs, 2024/2025
Exhibit 25: U.S. Pharmacy Franchise Locations, by Company, 2015 to 2025
Exhibit 26: Customer Satisfaction with Pharmacies, by Dispensing Format and Company, 2025
Exhibit 27: Largest Pharmacy Services Administrative Organizations, by Membership and Ownership, 2025
Exhibit 28: Pharmacy Buying Groups and Primary/Preferred Wholesaler Relationships, by Number of Pharmacies, 2025
Exhibit 29: Wholesaler Generic Source Programs, Number of SKUs and Manufacturers, 2011 to 2024
Exhibit 30: Largest U.S. Pharmacies and Their Primary Wholesale Suppliers, 2025
Exhibit 31: Full-Line Wholesaler Sales to Retail Chain Warehouses, 2007 to 2023
Exhibit 32: Share of U.S. Generic Purchasing Volume, by Organization, 2025
Exhibit 33: Pharmacy Locations with Specialty Pharmacy Accreditation, by Corporate Ownership, 2024
Exhibit 34: Specialty Drug Prescription Revenues, by Dispensing Format, 2024
Exhibit 35: Prescription Revenues and Market Share from Specialty Pharmaceuticals, by Company, 2024
Exhibit 36: Specialty Pharmacy Networks, Participation Rate by Company, 2025
Exhibit 37: Alternative Channels to Specialty Pharmacies in Limited Dispensing Networks
Exhibit 38: Medical Benefit Spending on Outpatient Provider-Administered Drugs, by Drug Category and Payer, 2023
Exhibit 39: Spending for Outpatient Medical Benefit Drugs, by Site of Care and Payer, 2023
Exhibit 40: Medicare Advantage Spending for Outpatient Provider-Administered Drugs, by Site of Care and Drug, 2023
Exhibit 41: Commercial Medical Benefit Spending for Outpatient Provider-Administered Drugs, by Site of Care and Drug, 2023
Exhibit 42: Total Drug Purchases by Nonfederal Hospitals and Outpatient Clinics, 2018 to 2024
Exhibit 43: Components of Change in Total Provider-Administered Drug Purchases, Nonfederal Hospitals vs. Outpatient Clinics, 2024
Exhibit 44: Buy-and-Bill System for Distribution and Reimbursement of Provider-Administered Outpatient Drugs
Exhibit 45: Primary Roles of Third-Party Payer, Distributor, and Provider in Buy-and-Bill System
Exhibit 46: Share of Commercial Plan Sponsors Receiving Specialty Drug Rebates, Pharmacy vs. Medical Benefits, 2024
Exhibit 47: Chargebacks as a Percentage of Net Sales, Full-Line Wholesalers, 2009 to 2024
Exhibit 48: Reimbursement for Provider-Administered Specialty Drugs vs. Specialty Pharmacies, by Site of Care and Therapeutic Class, 2021
Exhibit 49: White Bagging Approach for Distribution and Reimbursement of Provider-Administered Outpatient Drugs
Exhibit 50: UnitedHealthcare, White Bagging Requirements for Hospital Outpatient Providers, by Specialty Pharmacy, 2025
Exhibit 51: Drug Sourcing for Infused Oncology Therapies, by Practice Type and Source, 2019 vs. 2024
Exhibit 52: Payer Reimbursement and Patient Out-of-Pocket Obligation for Oncology Drugs, White Bagging vs. Buy-and-Bill, 2020
Exhibit 53: Share of Hospitals Permitting Pharmacy Sourcing of Infused Drugs, by Source, 2020 vs. 2022
Exhibit 54: Distribution of Medicare Part B Add-on Payments, 2021
Exhibit 55: Reimbursement Method for Provider-Administered Drugs Paid Under the Commercial Medical Benefit, by Site of Care
Exhibit 56: Reimbursement Method for Biosimilars of Provider-Administered Drugs Paid Under the Commercial Medical Benefit, 2021
Exhibit 57: Distribution of Hospitals’ Cost-to-Charge Ratio for Pharmaceuticals, 2023
Exhibit 58: Reimbursement Rate and Administration Cost for Provider-Administered Drugs Paid Under the Commercial Medical Benefit, by Site of Care, 2024
Exhibit 59: Markups for Provider Administered Specialty Drugs for Privately Insured Individuals, by Site of Care and 340B Status, 2020/2021
Exhibit 60: Commercial Medical Benefit Cost per Claim for Reference Biologics and Their Biosimilars, by Site of Care, 2019 to 2023
Exhibit 61: Hospital Reimbursement by Commercial Payers, Avastin and Its Biosimilars, by Payer and Product, 2025
Exhibit 62: Commercial Health Plans’ Site-of-Care Programs for Provider-Administered Specialty Drugs, by Plan Type, 2024
Exhibit 63: Cigna Healthcare, Number of Specialty Drugs Subject to Site-of-Care Medical Policy, 2018 to 2025
Exhibit 64: Patient Cost Sharing for Provider-Administered Drugs
Exhibit 65: Medicare Part B Coinsurance Adjustments, 2023:Q2 to 2025:Q1
Exhibit 66: Annual Rebate per Medicare Advantage Beneficiary, by Extra Benefit Type, 2020 to 2025
Exhibit 67: Revenue Mix at Oncology Practices, by Category
Exhibit 68: Specialty Physician Practice GPOs and Ownership, 2025
Exhibit 69: Share of Oncologists in Practices with Medically Integrated Dispensing, by Practice Setting, 2010 to 2024
Exhibit 70: Initial and Final Prescription Claim Status for Brand-Name Oral Oncology Therapies, by Site of Dispensing, 2023
Exhibit 71: U.S. Hospitals, by Type and Ownership, 2023
Exhibit 72: Share of Community Hospitals, by Health System Affiliation, 1993 to 2023
Exhibit 73: Hospital Mergers & Acquisitions, Total Announced Transacted Revenue, 2011 to 2025
Exhibit 74: Ten Largest Integrated Delivery Networks, by Net Patient Revenues, 2023
Exhibit 75: Hospital Operating Expenses, by Type of Expense, 2024
Exhibit 76: Prescription Drug Costs as a Percentage of Hospital Expenses, 2014 to 2024
Exhibit 77: Change in Hospital Drug Expense per Adjusted Discharge, 2020 to 2025
Exhibit 78: Total Cost of Drugs and Cost-to-Charge Ratio, Top 10 Hospitals, 2023
Exhibit 79: Number and Share of Pharmacists Employed by Hospitals, 2010 to 2024
Exhibit 80: Number of Inpatient Pharmacists and Pharmacy Technicians per 100 Occupied Hospital Beds, 2019 to 2024
Exhibit 81: Largest Group Purchasing Organizations, by Membership and Total Purchasing Volume, 2025
Exhibit 82: Hospital and Clinic Share of Oral Oncology Market, 2017 to 2024
Exhibit 83: Hospitals’ Perceived Barriers to Accessing Specialty Pharmacy Networks, 2020 vs. 2022
Exhibit 84: 340B Drug Pricing Program, Purchases by Covered Entities, 2010 to 2024
Exhibit 85: 340B Contract Pharmacy Relationships with Hospitals, by Company, 2020 vs. 2025
Exhibit 86: Key Elements on a Wholesaler’s Income Statement
Exhibit 87: Sources of a Wholesaler’s Gross Margin from Brand-Name Drugs
Exhibit 88: U.S. Core Drug Distribution Gross Margin, Big Three Wholesalers, 2021 to 2025
Exhibit 89: U.S. Drug Distribution Gross Profits, Big Three Wholesalers, Total and Annual Change, 2021 to 2025
Exhibit 90: Estimated Buy-Side and Sell-Side Contributions to Wholesalers’ Gross Margin, 2025
Exhibit 91: Estimated Drug Distribution Gross Margin, by Drug and Customer Type, 2025
Exhibit 92: Revenues and Gross Profits, Big Three Wholesalers, by Type of Drug, 2025
Exhibit 93: Median Wholesaler Sell-Side Discount for Generic Drugs Sold to Retail Pharmacies, by Number of Manufacturers, 2025
Exhibit 94: Path of Wholesaler Gross Profits, Brand vs. Multisource Generic Drug
Exhibit 95: Example of Channel Profits from a Provider-Administered Generic Drug
Exhibit 96: Medicare Part D and Medicaid Prescription Reimbursement for Wholesalers’ Private Label Generic Drugs, By Company, 2019 to 2023
Exhibit 97: Brand-Name Drugs, Change in Average List and Net Prices, 2014 to 2025
Exhibit 98: Illustrative Value of a Wholesaler’s Buy-Side Fees with Alternative Brand-Name Pharmaceutical Price Inflation Scenarios
Exhibit 99: Price Indices for Warehousing & Storage and Truck Transportation, 2020 to 2025
Exhibit 100: Illustrative Value of a Wholesaler’s Buy-Side Fees with Brand-Name Pharmaceutical Price Deflation
Exhibit 101: Illustrative Effect of Inventory Revaluation on a Wholesaler’s Gross Profit
Exhibit 102: Full-Line Wholesalers, Operating Expenses, by Category, 2021 to 2023
Exhibit 103: Median Annual Total Employee Compensation, by Company, 2024
Exhibit 104: Drug Distribution Operating Profit Margin as a Percentage of Revenues, Big Three Wholesalers, 2021 to 2025
Exhibit 105: Total Corporate Operating Profits as a Percentage of Total Corporate Gross Profits, Big Three Wholesalers, 2025
Exhibit 106: Total Debt Including Interest Payments, Big Three Wholesalers, 2025
Exhibit 107: Debt-to-EBITDA Ratio, Big Three Wholesalers, FY2023 to FY2025
Exhibit 108: Liquidity Ratios, Big Three Wholesalers, FY2025
Exhibit 109: Composition of Current Assets, Big Three Wholesalers, 2025
Exhibit 110: Illustrative Wholesaler Cash Conversion Cycle for Brand-Name Drugs Sold to a Pharmacy
Exhibit 111: Cash Conversion Cycle, Big Three Wholesalers, 2025
Exhibit 112: Cash Conversion Cycle, Big Three Wholesalers, 2015 to 2025
Exhibit 113: Days Sales in Inventory, Big Three Wholesalers, 2021 to 2025
Exhibit 114: Days Sales Outstanding, Big Three Wholesalers, 2021 to 2025
Exhibit 115: Percentage of Wholesalers’ Trade Accounts Receivable and DSO for Largest Customers, 2025
Exhibit 116: Days Payable Outstanding, Big Three Wholesalers, 2021 to 2025
Exhibit 117: Capital Deployment, Big Three Wholesalers, FY2021 to FY2025
Exhibit 118: Dividends and Share Repurchases as a Percentage of Operating Cash Flow, Big Three Wholesalers, FY2023 to FY2025
Exhibit 119: Return on Invested Capital, Big Three Wholesalers, 2019 to 2025
Exhibit 120: Forward Price-to-Earnings Ratio, Big Three Wholesalers vs. S&P 500, 2014 to 2025
Exhibit 121: One- and Five-Year Stock Price Performance, Big Three Wholesalers vs. Manufacturers and Overall Market
Exhibit 122: Components of CEO Compensation, Big Three Wholesalers, 2024/25
Exhibit 123: Financial Metrics Used for Annual Cash Incentive Compensation, Big Three Wholesalers, 2024/25
Exhibit 124: Financial Metrics Used for Long-Term Incentive Compensation, Big Three Wholesalers, 2024/25
Exhibit 125: U.S. Gross Manufacturer Revenues, Annual Total and Growth, 2019 to 2029
Exhibit 126: Total Value Lost to Generic and Biosimilar Launches, by Product Type, 2021 to 2029
Exhibit 127: U.S. Drug Distribution and Related Revenues, Big Three Wholesalers, 2019 to 2029
Exhibit 128: Summary of List Price Reductions for Selected Brand-Name Drugs, 2024/2025
Exhibit 129: Average Year-over-Year Change in Pricing of Mature Generic Drugs, Oral vs. Injectable, 2015 to 2025
Exhibit 130: Generic Drug Approvals, FDA, 2014 to 2025
Exhibit 131: National Opioid Settlement Payments, by Company, 2025
Exhibit 132: Vertical Business Relationships Within the U.S. Drug Channel, 2025
Exhibit 133: Pharmacy Industry Prescription Revenues, Traditional vs. Specialty Drugs, 2019 to 2029
Exhibit 134: Top Specialty Therapy Categories, Generic Drugs as a Share of Prescriptions and Net Spending, 2024
Exhibit 135: Nonbiological Specialty Drugs, Pharmacy Acquisition Cost per Unit for Brand-Name vs. Generic Version, 2024
Exhibit 136: Dispensing Spreads for Specialty Generic Drugs at PBM-Affiliated Pharmacies, 2017 to 2021
Exhibit 137: Physician Employment, by Practice Ownership, 2012 vs. 2024
Exhibit 138: Number of Physicians per Practice, by Practice Ownership, 2024
Exhibit 139: U.S. Physician Employment, by Specialty and Employer Type, 2022
Exhibit 140: Number of U.S. Physicians Employed by Hospitals/Health Systems, 2019 to 2024
Exhibit 141: Acquisitions of Community Oncology Practices, by Type of Acquirer, 2010 to 2024
Exhibit 142: Share of Medicare Part B Fee-For-Service Spending on Provider-Administered Outpatient Drugs, by Location of Service, 2008 to 2023
Exhibit 143: Share of Specialty Distributor Revenues, by Customer Type, 2011 to 2023
Exhibit 144: Number of Private Equity Acquisitions of Physician Practices, 2013 to 2025
Exhibit 145: Management Service Organizations Acquired by Large Wholesalers, 2023 to 2025
Exhibit 146: Revenue Sources at Community Physician Practices, By Specialty, 2025
Exhibit 147: Number of U.S. Biosimilar Approvals, 2015 to 2025
Exhibit 148: Physician Perceptions of Biosimilars, by Specialty, 2023
Exhibit 149: Formulary Coverage and Pricing for Humira and Its Biosimilars, by PBM, 2025
Exhibit 150: Formulary Coverage and Pricing for Stelara and Its Biosimilars, by PBM, 2025
Exhibit 151: FDA-Approved Biosimilars, Provider-Administered Drugs, 2025
Exhibit 152: Market Share of Provider-Administered Biosimilars, 2020 vs. 2025
Exhibit 153: Provider-Administered Oncology Drugs, Prices of Biosimilars vs. Reference Product, 2025
Exhibit 154: Formulary Coverage Status of Provider-Administered Drugs at U.S. Commercial Payers, Reference Products vs. Biosimilars, 2017 to 2022
Exhibit 155: Payer Formulary Coverage of Provider-Administered Oncology Biosimilars, 2022 to 2024
Exhibit 156: Standard Medicare Prescription Drug Benefit, 2024 vs. 2025
Exhibit 157: Prices for Products Selected for 2026 Medicare Drug Price Negotiation Program, by Total and Out-of-Pocket Spending
Exhibit 158: Quarterly Change in Specialty Drug Utilization, by Beneficiary Income, 2024
Exhibit 159: Number of Stand-Alone Medicare Part D Prescription Drug Plans, 2007 to 2026
Exhibit 160: Illustrative Effect of Inflation Reduction Act on Medicare Part B Margins, 340B Hospitals vs. Community Practices
Exhibit 161: Cencora, Pharmaceutical Distribution Segment, Profitability Metrics, 2021 to 2025
Exhibit 162: Cencora, Estimated Revenues and Operating Profit, by Segment, FY2025E
Exhibit 163: Cencora, Top 10 U.S. Drug Distribution Customers, FY2025
Exhibit 164: Cencora, Revenues from Walgreens Boots Alliance, 2015 to 2025
Exhibit 165: Cencora, Days Sales Outstanding from Walgreens and Express Scripts vs. All Other Customers, 2021 to 2025
Exhibit 166: Cencora, Revenues from Evernorth Health Services, 2014 to 2025
Exhibit 167: Evernorth Health Services, Pharmacy Dispensing Revenues vs. Pharmaceutical Purchases Through Cencora, 2014 to 2025
Exhibit 168: Cencora, U.S. Pharmaceutical Distribution, Revenues and Growth, 2020:Q1 to 2025:Q2
Exhibit 169: MWI Animal Health, Revenues and Growth, 2021 to 2025
Exhibit 170: Animal Health Products Distribution Market Share, by Company and Segment, 2014 vs. 2025
Exhibit 171: Number of Pharmacies per Capita, Major European Countries, 2023
Exhibit 172: Alliance Healthcare, Revenues and Growth, 2021 to 2025
Exhibit 173: Cardinal Health, Profitability Metrics, 2021 to 2025
Exhibit 174: Cardinal Health, Estimated Revenues and Operating Profit, by Segment, FY2025
Exhibit 175: Cardinal Health, Top 10 U.S. Drug Distribution Customers, FY2025
Exhibit 176: Cardinal Health, Revenues from CVS Health, 2010 to 2025
Exhibit 177: Cardinal Health, Days Sales Outstanding from CVS Health and Optum Rx vs. All Other Customers, 2021 to 2025
Exhibit 178: Cardinal Health, U.S. Pharmaceutical Distribution, Revenues and Growth, 2021:Q1 to 2025:Q2
Exhibit 179: McKesson, Distribution Businesses, Gross and Segment Operating Profitability Metrics, 2021 to 2025
Exhibit 180: McKesson, Estimated Revenues and Operating Profit, by Segment, FY2025
Exhibit 181: McKesson, Top 10 U.S. Drug Distribution Customers, FY2025
Exhibit 182: McKesson, Revenues from CVS Health, 2011 to 2025
Exhibit 183: McKesson, Days Sales Outstanding, CVS Health vs. All Other Customers, 2021 to 2025
Exhibit 184: McKesson, Revenues from Rite Aid, 2016 to 2025
Exhibit 185: Cardinal Health, Revenues from Optum Rx, 2016 to 2024
Exhibit 186: McKesson, U.S. Pharmaceutical Distribution, Revenues and Growth, 2021:Q1 to 2025:Q2
Exhibit 187: McKesson Canada, Revenues and Growth, 2021 to 2025